
通过 Ngnix 日志监控
1 Nginx
1.1 安装
1 | yum -y install yum-utils |
1.2 配置
1 | vim /etc/nginx/nginx.conf |
2 Clickhouse
2.1 准备配置文件
1 | cat >> docker-compose.yml <<EOF |
2.2 关闭监听地址
1 | # 第3行如下: |
2.3 配置主文件
1 | cat >> config/config.xml <<EOF |
2.4 配置用户
这里我都配置一个密码了
1 | #PASSWORD=$(base64 < /dev/urandom | head -c8); echo "$PASSWORD"; echo -n "$PASSWORD" | sha256sum | tr -d '-' |
2.5 创建数据库
1 | docker exec -it clickhouse clickhouse-client --user nginx --password 1qaz@WSX |
3 Grafana
3.1 安装插件
1 | docker container exec -it grafana grafana cli plugins install grafana-clickhouse-datasource |
3.2 测试访问 Clickhouse
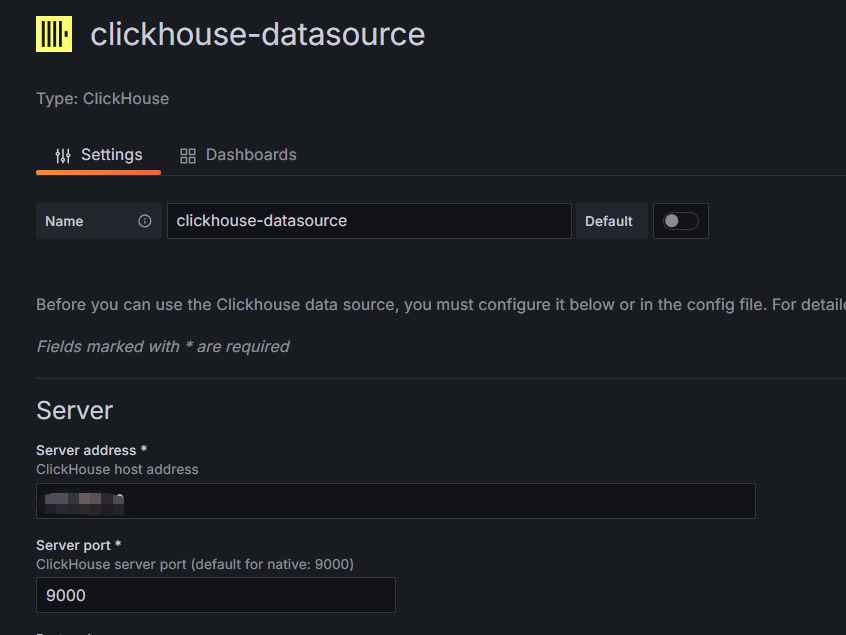
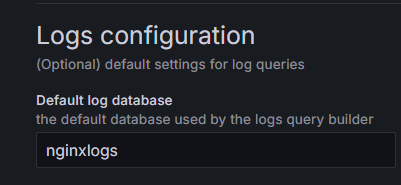
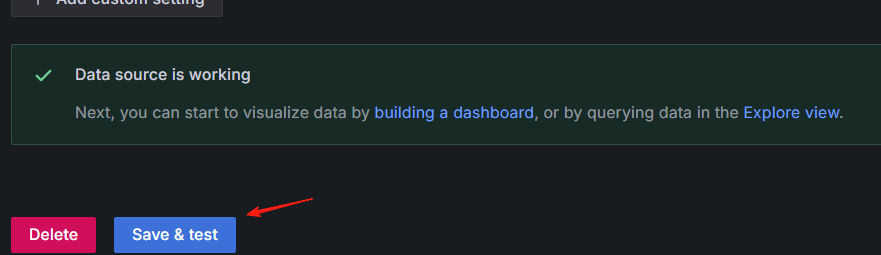
4 部署Vector采集日志
4.1 Vector部署
1 | # 创建部署目录和docker-compose.yaml |
4.2 Vector配置
1 | cd conf |
4.2.1 Nginx 日志采集
1 | vim nginx-access.yaml |
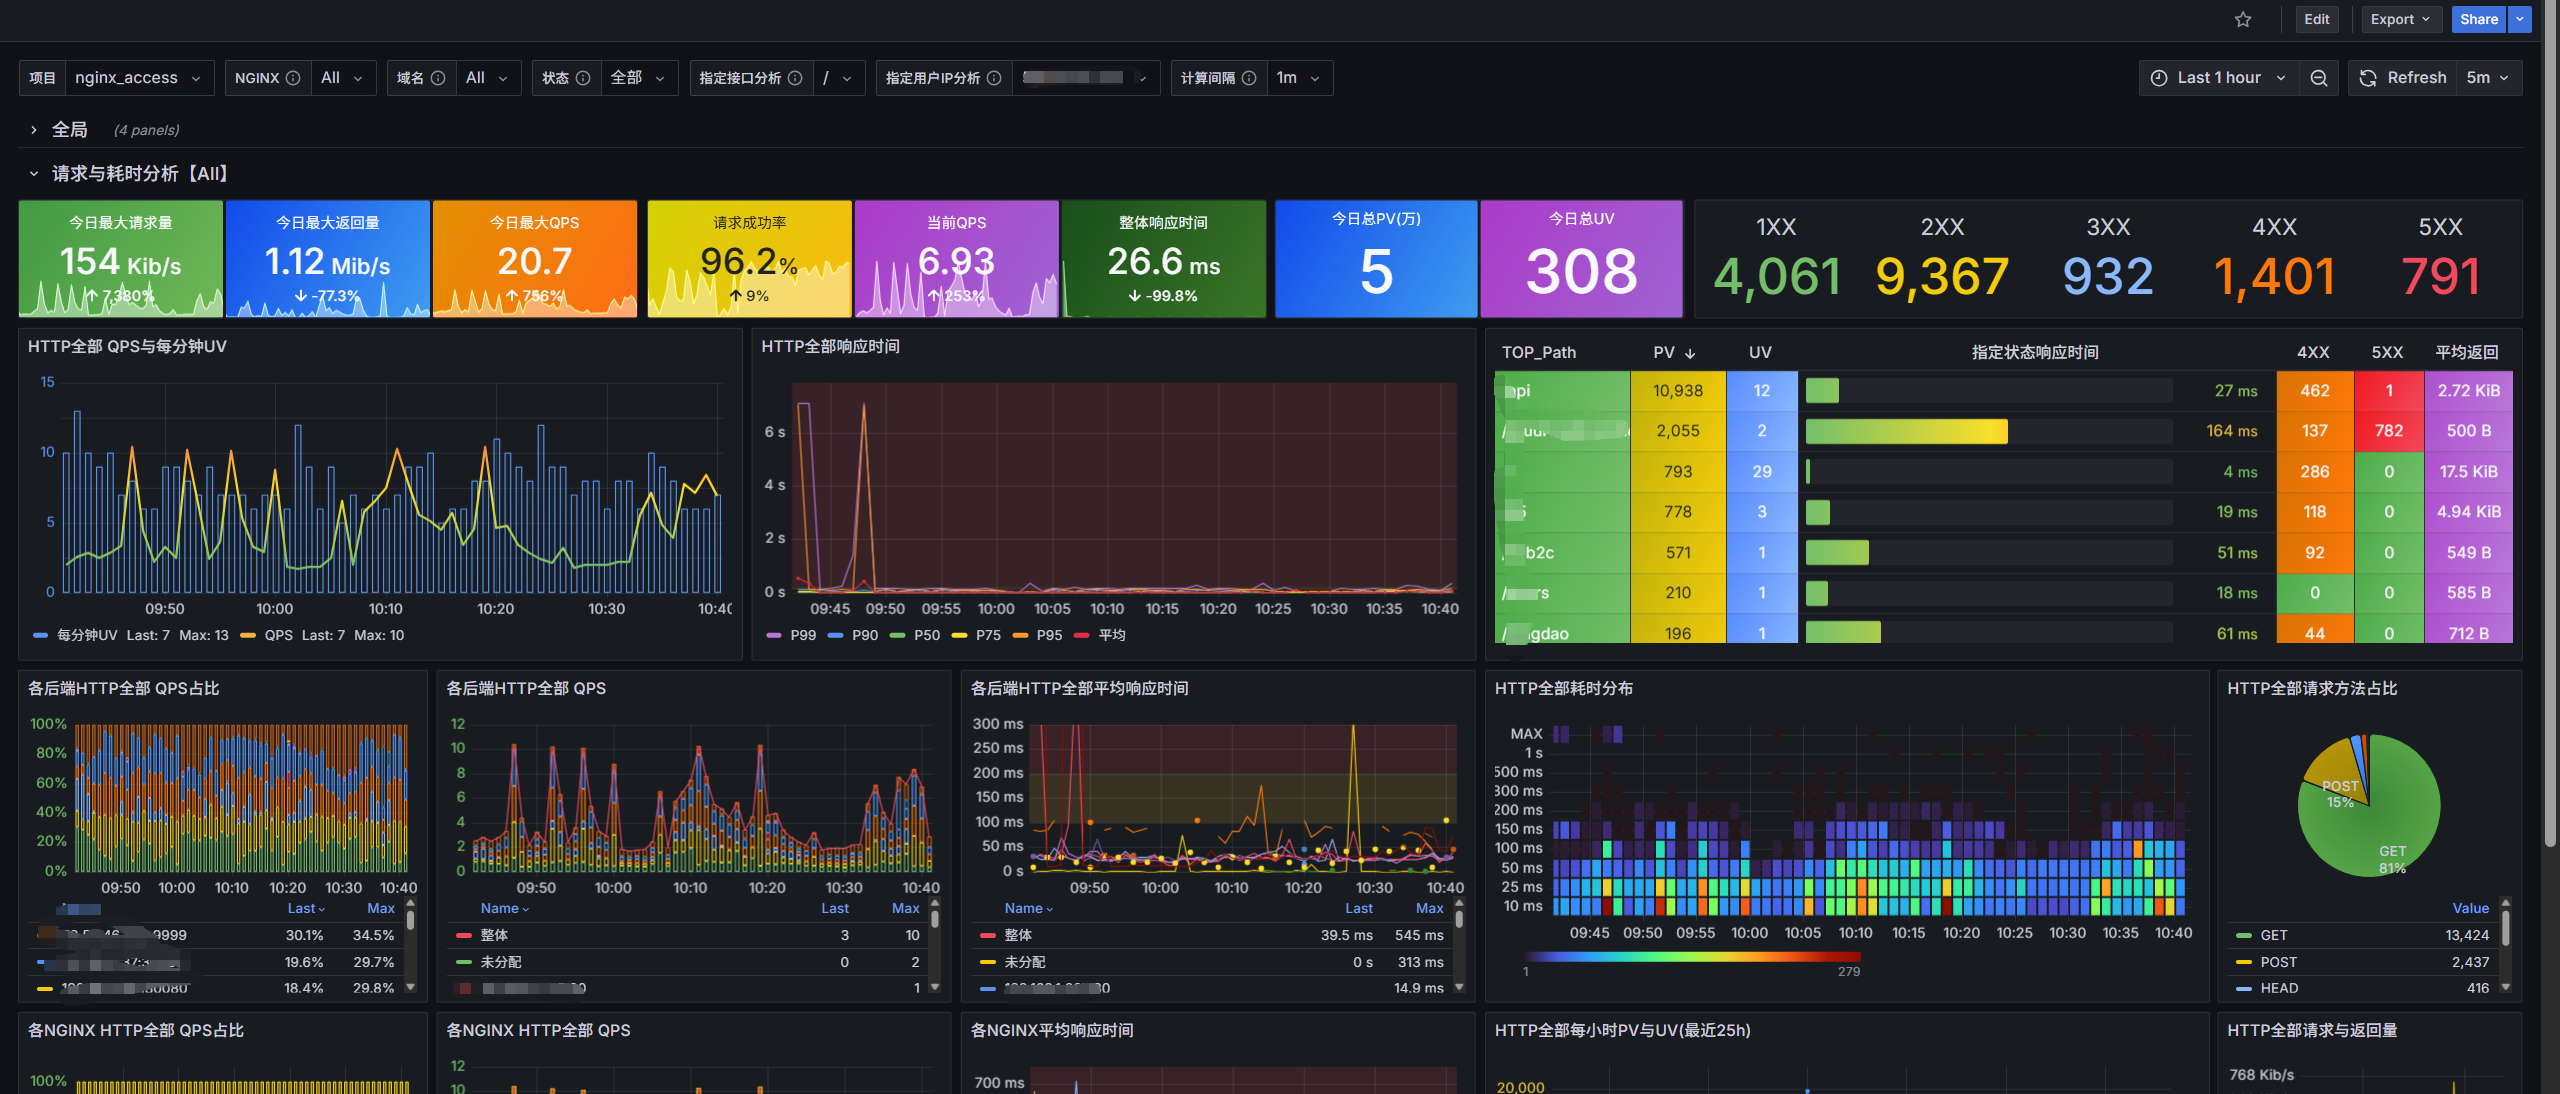
5 Grafana Dashboards
NGINX请求日志分析看板 20241024 StarsL.cn | Grafana Labs
6 告警
Info
这里使用夜莺告警, 原理差不多, 主要是查询语句
6.1 分钟内 Xx 域名放过 500 次数
1 | SELECT count() AS error_count |
文章参考: 云原生日志平台:采集、可视化分析、监控 全实践
本博客所有文章除特别声明外,均采用 CC BY-NC-SA 4.0 许可协议。转载请注明来源 OpsCC!
相关推荐

2021-11-15
记录一次解决cc攻击
录一次 cc 攻击] 虽然没完全解决,但是屏蔽大量攻击,减轻服务器负担.此文档只是简单介绍下 web 防火墙原理 1 泳道图 2 配置 Nginx cat conf.d/wxh.super.co.conf 123456789101112131415161718192021limit_req_zone $remote_addr zone=allips:10m rate=30r/s; # 每个ip一秒30次# limit_req zone=allips; #全局限制server {server_name wxh.super.com;......if ($request_uri ~* "kto0a81u") {return 503;} #只要访问以kto0a81u为结尾的连接自动跳到503location /{ allow 122.14.1.21; #白名单 limit_req zone=allips #限制访问/user/login链接每个ip一秒10次 try_files $uri...
2021-11-15
nginx问题记录
1 访问过慢 现象: 突然f5 检查后端 Nginx 节点,大部分 Nginx 节点总是连接超时,而看监控 nginx 资源使用率都正常 1.1 尝试查看日志 123...... shm_add_node::ngx_slab_alloc_locked() failed: used_size[36127530], used_node[10178]... 1.1.1 查看内存分配 自定义标题 其实不是这原因,以为请求分配不了内存,但这里写一下查询方法 1234cat /proc/buddyinfoNode 0, zone DMA 1 0 0 0 2 1 1 0 1 1 3 Node 0, zone DMA32 25063 30201 27755 7226 864 202 138 123 105 0 0 Node 0, zone Normal 470959 338802 12611...

2021-12-10
Nginx Ingress常用配置
发现大部分架构都是 nginx 代理后端,挂载前端提供服务。但是放到 k8s 还得单独启动个 nginx 部署前端,这就造成两个问题。 1:配置复杂,每加有新的服务调用,不仅要改 ingress,web 服务的 nginx 配置文件也需要修改。 2:访问复杂,变成了 dns>ingress>web>后端 经过修改,我们的架构图 1 正常需要添加的参数 123456789nginx.ingress.kubernetes.io/client-body-buffer-size: 2mnginx.ingress.kubernetes.io/enable-access-log: 'true'nginx.ingress.kubernetes.io/enable-cors: 'true'nginx.ingress.kubernetes.io/proxy-body-size: 10mnginx.ingress.kubernetes.io/proxy-buffer-size: 2mnginx.ingress.kubernetes...

2023-02-01
Nginx 调优
一,核心配置 找到 Nginx 安装目录下的 conf 目录下 nginx.conf 文件,Nginx 的基本功能配置是由它提供的。 1 配置文件结构 Nginx 的配置文件 (conf/nginx.conf) 整体上分为如下几个部分: 区域 职责 全局块 配置和 Nginx 运行相关的全局配置 events 块 配置和网络链接相关的配置 http 块 配置代理、缓存、日志记录、虚拟主机等配置 server 块 配置虚拟主机的相关参数,一个 http 快中可以有多个 server 块 location 块 配置请求的路由,以及各种页面的处理情况 配置层级如下所示。 123456789101112131415161718events {}http { server { server_name a; location / { } location ~*^.+$ { } &...


